Study day: Modern timber construction in historic Amsterdam
Published
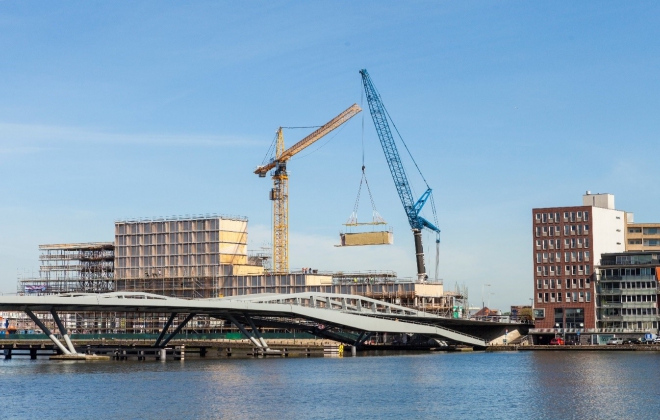
Photo: DERIX Group
DERIX Group invites you to the study day "Modern timber construction in historic Amsterdam" on 26.10.2017. The event will take place in the new ABN AMRO Pavilion in Amsterdam, in the construction of which DERIX Group was involved.
In co-operation with the Dutch Houtblad, architects and planners from the Netherlands will gain vivid and exciting insights into modern timber construction on the basis of current major projects and will be comprehensively informed about the special features of glulam and X-LAM as future-oriented building materials.
In the second part of the study day, excursions to the previously discussed construction projects will take place: Here, the participants will visit the nine-storey "Jakarta" hotel, which is made up of X-LAM modules, and the "De 7 Deugden" brewery, which was also built entirely from X-LAM. A total of 200m³ of X-LAM was used for the wall, ceiling and roof elements.
In addition to specialist information and excursions, the study day offers a good opportunity to expand your own network. Get into dialogue with other architects and planners and benefit from a stimulating exchange with your colleagues.
The number of participants is limited to 100 people. Secure your participation and register by 01 October 2017:
Information and registration
www.houtblad.nl/modernehoutbouw
Average building land prices for individual development by district type 2007 to 2016 Fig.: BBSR Bonn
Between 2011 and 2016, the average price of building land for owner-occupied homes across Germany rose by 27 per cent from 129 euros per square metre to 164 euros. In the major cities, the price per square metre of building land rose by 33 per cent - from just over EUR 250 in 2011 to just under EUR 350 in 2016. This not only makes residential property significantly more expensive, but also puts the brakes on affordable rental housing construction. This is the result of an analysis by the Federal Institute for Research on Building, Urban Affairs and Spatial Development (BBSR).
The analysis is based on purchase price data from the official expert committees for property values for the last five years. In the urban and rural districts, the price level and increase lagged behind the major cities. However, even there the increase was well above the general rate of inflation. In the urban districts - often districts surrounding large cities - purchase prices for undeveloped land rose from 132 euros per square metre in 2011 to 156 euros per square metre in 2016 (+19 per cent), while in the rural districts, the price per square metre of building land rose from 64 euros to 78 euros in 2016 (+20 per cent).
The average purchase price for a plot of land for owner-occupied development also rose significantly - by 27 per cent to EUR 112,000 in 2016. In the major cities, the average purchase price for a plot of land for owner-occupied development was just under EUR 200,000 (+ 25 per cent). Average purchase prices have risen particularly sharply in expensive cities. "Rising land prices determine the purchase or construction costs to a considerable extent, especially in the growth regions. This makes residential property more expensive," says BBSR expert Matthias Waltersbacher. "In tight markets, high building land prices are also driving rents for new builds up to EUR 14 to 16 per square metre. This means that privately financed residential construction at affordable rents is no longer possible."
While the transaction figures for plots of land for owner-occupier development remained fairly stable in the urban districts between 2011 and 2016, they fell by 30 per cent in the major cities. Transactions fell particularly sharply in expensive cities such as Cologne, Frankfurt am Main and Stuttgart. Rural districts recorded an increase of just under 15 per cent in the same period. "Property prices have recently risen so sharply that the pressure to realise them often no longer allows for the development of single-family homes," says Waltersbacher. "More and more buyers are looking for alternatives in the surrounding area."
The analysis is based on an examination of the independent cities and rural districts for which transaction data for properties is available via the purchase price collections of the expert committees for property values in a complete time series since 2011. This representative longitudinal section covers around a third of all cities and districts in Germany. A comprehensive analysis of the land and property market for the years 2015 and 2016 will be presented by the Working Group of the Higher Expert Committees, Central Offices and Expert Committees in the Federal Republic of Germany (AK OGA) in December 2017 with the German Property Market Report.
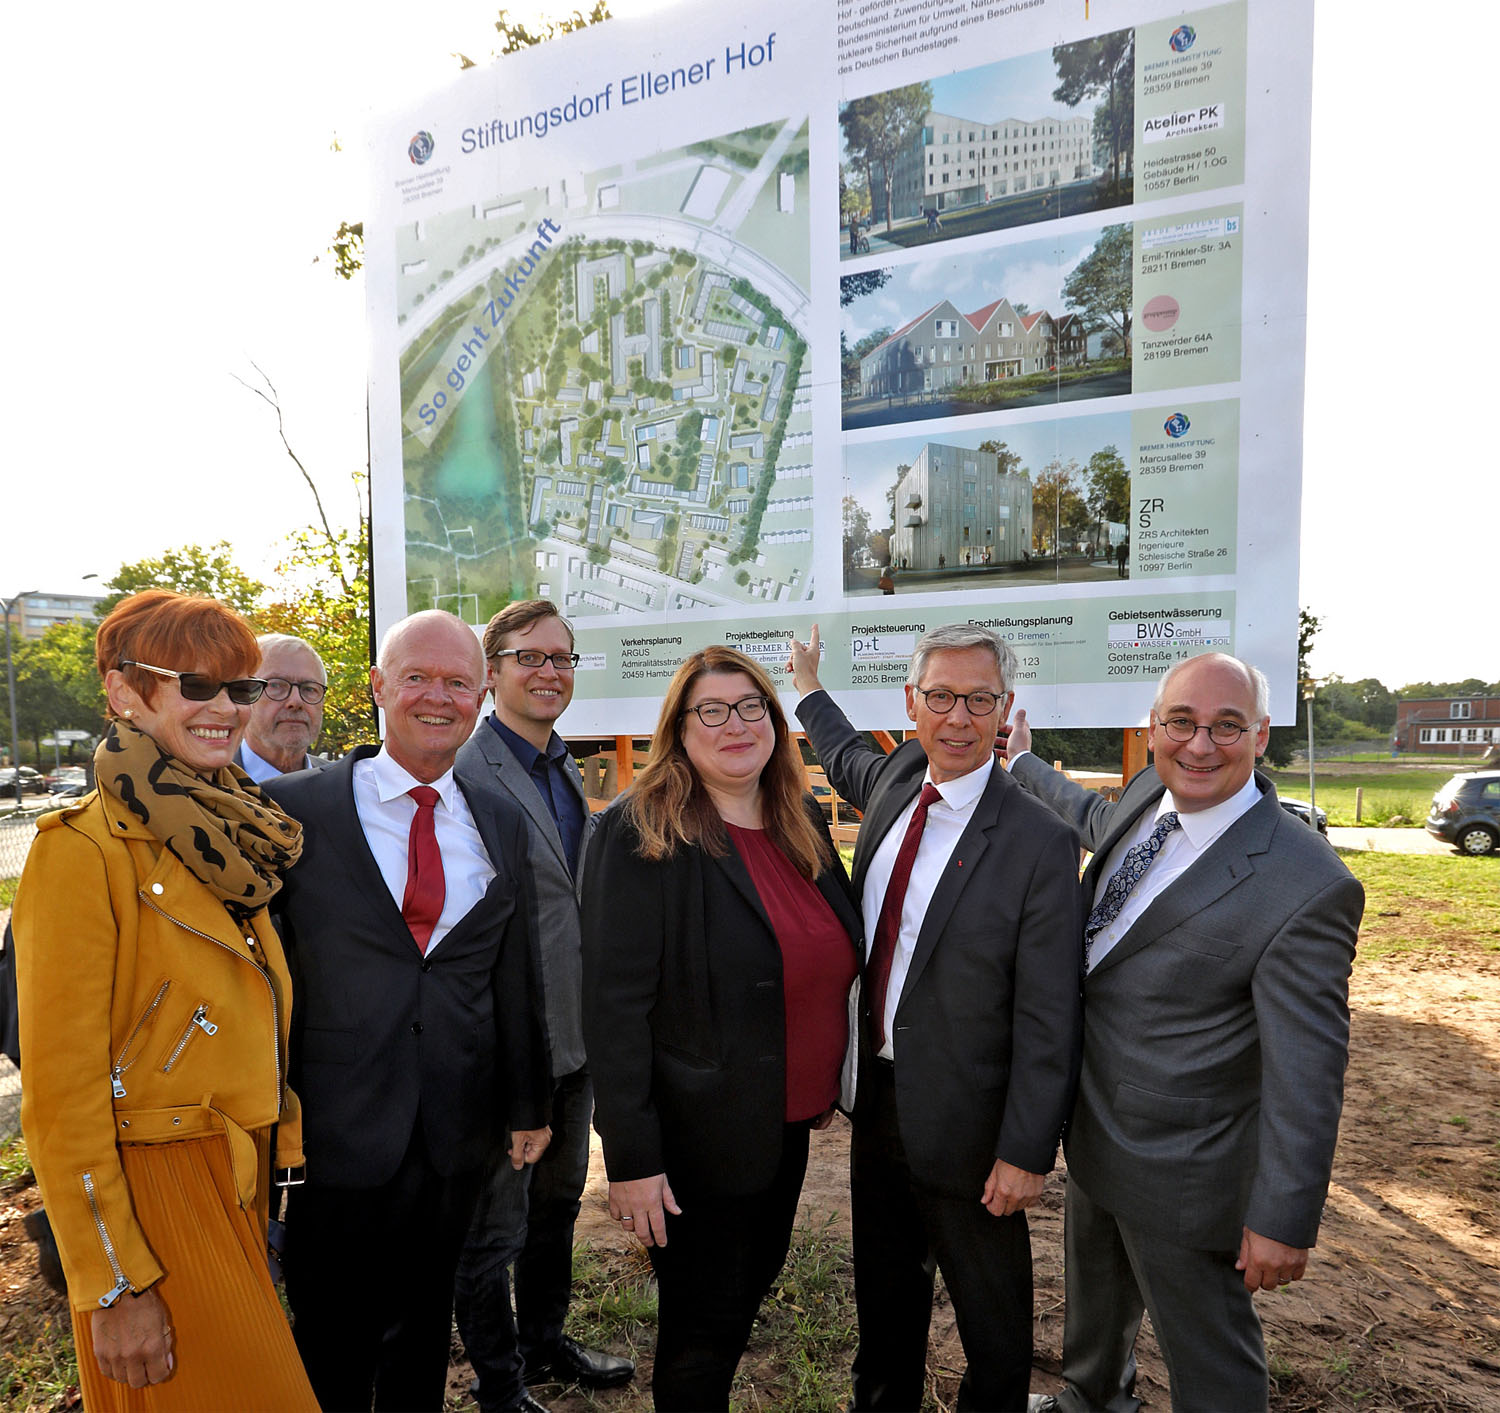
Together with the unveiling of the building sign, they heralded the start of construction on the grounds of the Ellener Hof Foundation Village: (from left) Sabine Schöbel.) Sabine Schöbel, Head of the Ellener Hof Foundation Village, Wolfgang Haase, Speaker of the Advisory Board in Osterholz, Alexander Künzel, Senior Director of the Bremen Home Foundation, Jens Deutschendorf, State Councillor at the Senator for the Environment, Construction and Transport, Anja Stahmann, Senator for Social Affairs, Youth, Women, Integration and Sport, Bremen's Mayor Dr. Carsten Sieling and André Vater, Chairman of the Board of the Bremen Home Foundation. Photo: Bremer Heimstiftung, Photographer: Martin Rospek
In a recently written short study, scientists from the Department of Energy System Analysis at the Fraunhofer Institute for Solar Energy Systems ISE prepared an evaluation of the Market Master Data Register (MaStR) and the EEG system master data for photovoltaics (PV). Important findings of the analyses were that with 38 percent of the newly installed capacity, the increase in capacity in Germany is increasingly taking place in the segment of rooftop systems larger than 100 kW, 22 percent of the newly built PV systems are erected in a west, east or east-west direction and 19 percent of these systems have tilt angles smaller than 20 degrees.
Relative shares of the different orientations in the construction of new plants. Source: Own calculation based on MaStR data registered as of 31.01.2019 (as of 03.03.2020).
The Market Master Data Register (MaStR) is the register for the German electricity and gas market. Since January 2021, all electricity generation units connected to the general supply grid must be entered in it. This also applies to the steadily growing number of photovoltaic systems in Germany. In addition to the master data on output and location of a PV system, which has already been recorded in the Renewable Energy Sources Act register (EEG system master data), the market master data register records further information such as orientation, inclination and output limitation.
These parameters have now been analyzed by scientists at Fraunhofer ISE. The evaluation covers the period from 2000 to the present day and shows the development over time in terms of number, power, location by federal state, orientation, inclination and power limitation. Different evaluation criteria were taken into consideration, which allow statements to be made on the following aspects: Plant addition, power addition by plant class, plant addition by federal state, plant orientation and inclination angle.
Fraunhofer ISE evaluates these central parameters at regular intervals and makes the results publicly available. In addition, the Institute offers further evaluations of this database on request.
82 percent of the added systems are smaller than 10 kW
The evaluation of the installation of new systems by system class essentially shows that the <10 kW size range has remained constant since 2014 with an average share of 82 percent. Rooftop systems over 10 and up to 100 kW had a heyday between 2004 and 2011, when their share of new installations - in relation to the number of systems - averaged 43 percent.
Growing part of the added capacity is due to large rooftop systems
When examining the increase in capacity by plant class, it becomes clear that the high share of the <10 kW plant class in terms of the number of plants is only reflected in a high increase in capacity to a limited extent. The share of the plant class has remained fairly constant at an average of 19 percent since 2014. One system segment whose relative share of capacity growth has increased sharply is the system class of rooftop systems from 100 to 750 kW. From 17 percent in 2012, their share has more than doubled to 38 percent in 2019. In contrast, the importance of ground-mounted systems has declined from 45 percent in 2012 to 20 percent in 2019.
More than half of the PV systems will no longer be built in Bavaria and Baden-Württemberg
The two states of Bavaria and Baden-Württemberg accounted for an average of 59.6 percent of new installations in Germany between 2000 and 2009, and this share declined to an average of 44.5 percent between 2010 and 2019. Over the same periods, North Rhine-Westphalia increased its average contribution from 14.1 to 18.3 percent, Lower Saxony's share rose from 6.5 to 9.2 percent, and Brandenburg's share increased from 0.7 to 2.2 percent. All the remaining federal states also recorded increases, albeit to a lesser extent. Despite the decline in their share, Bavaria and Baden-Württemberg remain in first and second place in terms of new installations in 2019, with 24.4 percent and 18.6 percent respectively. This is followed by North Rhine-Westphalia, Lower Saxony and Hesse with 17.9 percent, 9.2 percent and 6.1 percent respectively.
73 percent of newly installed PV systems are limited in their capacity
Only around a quarter of the newly installed plants in 2019 do not have any output limitation. According to the EEG, 66 percent of newly installed plants may only feed a maximum of 70 percent of their output into the grid because they do not have remotely controllable feed-in management. This proportion has grown by an average of 4 percentage points per year since 2014. The remaining output-limited plants have even higher limitations of 60 to 50 percent as a result of the combination with a battery storage system.
Increasing proportion of PV systems facing east and west
While the share of PV systems with southern orientation decreased from 61 percent in 2000 to 42 percent in 2019, the share of systems with eastern and western orientation increased at almost the same rate: east from 1 percent in 2000 to 7 percent in 2019, west from 3 percent in 2000 to 9 percent in 2019, east-west from 1 percent in 2000 to 6 percent in 2019.
Plants are increasingly being built with a lower angle of inclination.
The share of added PV systems (rooftop and ground-mounted) with a tilt angle of less than 20 degrees averaged 10 percent between the years 2000 and 2009. Subsequently, between 2010 and 2019, the share increased to an average of 19 percent. Systems with 20 to 40 degrees of tilt accounted for an average of 63 percent between 2000 and 2009, falling to 54 percent between 2010 and 2019.
"Our struggle for global sustainability will be lost or won in cities." With these words Ban Ki-moon, Secretary-General of the United Nations, opened the High-Level Delegation of Mayors and Regional Authorities in New York City on 23 April 2012.
A little more than three years later, at the United Nations (UN) Summit in 2015, the 2030 Agenda for Sustainable Development was adopted. In the Agenda, 17 Sustainable Development Goals (SDGs) define the key areas and mechanisms for a future global development partnership. One of these goals (SDG 11: "Make cities and human settlements inclusive, safe, resilient and sustainable") distinctly alludes to urban development. The urban community has widely celebrated the adoption of this "stand-alone urban goal". The step is perceived as reflecting an increased awareness of the important role of cities for global development pathways.
We use cookies to optimize our website and services.
Functional
Always active
Technical storage or access is strictly necessary for the legitimate purpose of enabling the use of a particular service explicitly requested by the subscriber or user or for the sole purpose of carrying out the transmission of a communication over an electronic communications network.
Preferences
The technical storage or access is necessary for the legitimate purpose of storing preferences that have not been requested by the subscriber or user.
Statistics
The technical storage or access, which is solely for statistical purposes.Technical storage or access used solely for anonymous statistical purposes. Without a subpoena, voluntary consent from your Internet service provider, or additional records from third parties, information stored or accessed for this purpose cannot generally be used alone to identify you.
Marketing
Technical storage or access is necessary to create user profiles, to send advertising or to track the user on a website or across multiple websites for similar marketing purposes.


![Extension.JPG [ JPG 0,13 MB ]](https://www.ise.fraunhofer.de/content/dam/ise/de/images/presseinfos/2021/Zubau.JPG)