Die EU-Staaten haben endgültig grünes Licht für die überarbeitete Richtlinie zur Energieeffizienz von Gebäuden gegeben und die neuen Vorgaben formell beschlossen. Kadri Simson, EU-Kommissarin für Energie, begrüßte das Votum: „Eine bessere Gesamtenergieeffizienz von Gebäuden ist von entscheidender Bedeutung, um unser Ziel der Klimaneutralität zu erreichen und die Energieunabhängigkeit Europas zu stärken. Renovierungen sind Investitionen in eine bessere Zukunft.“
Die neuen Rechtsvorschriften bilden den Rahmen für die Mitgliedstaaten zur Verringerung der Emissionen und des Energieverbrauchs von Gebäuden in der gesamten EU, von Wohnungen und Arbeitsplätzen bis hin zu Schulen, Krankenhäusern und anderen öffentlichen Gebäuden. Mit der überarbeiteten Richtlinie werden ehrgeizige Ziele zur Verringerung des Gesamtenergieverbrauchs von Gebäuden in der gesamten EU unter Berücksichtigung nationaler Besonderheiten festgelegt. Es überlässt den Mitgliedstaaten, welche Gebäude ins Visier genommen werden und welche Maßnahmen zu ergreifen sind. Sie wird die Nachfrage nach sauberen Technologien in Europa ankurbeln und Arbeitsplätze, Investitionen und Wachstum schaffen.
Jeder Mitgliedstaat wird seinen eigenen nationalen Zielpfad festlegen, um den durchschnittlichen Primärenergieverbrauch von Wohngebäuden bis 2030 um 16 Prozent und bis 2035 um 20-22 Prozent zu senken. Bei Nichtwohngebäuden müssen sie die 16 Prozent der Gebäude mit der schlechtesten Gesamtenergieeffizienz bis 2030 und die 26 Prozent der Gebäude mit der schlechtesten Gesamtenergieeffizienz bis 2033 renovieren. Die Mitgliedstaaten werden die Möglichkeit haben, bestimmte Kategorien von Wohn- und Nichtwohngebäuden, einschließlich historischer Gebäude oder Ferienhäuser, von diesen Verpflichtungen auszunehmen.
Die Bürgerinnen und Bürger werden bei ihren Bemühungen um eine Verbesserung ihrer Wohnung unterstützt. Die Richtlinie schreibt die Einrichtung zentraler Anlaufstellen für die Beratung bei Gebäuderenovierungen vor, und die Bestimmungen über die öffentliche und private Finanzierung werden Renovierungen erschwinglicher und realisierbarer machen.
Nullemissionsgebäude als neuer Standard
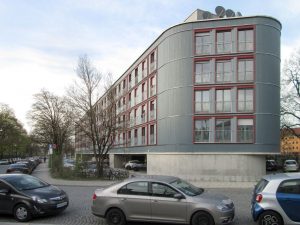
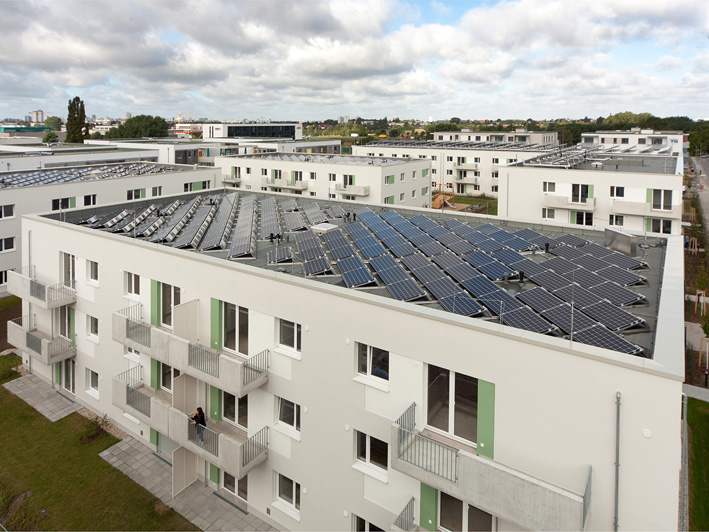
Mit der überarbeiteten Richtlinie werden Nullemissionsgebäude zum neuen Standard für Neubauten. Die verschärfte Richtlinie enthält neue Bestimmungen, at unter Berücksichtigung der nationalen Gegebenheiten schrittweise den Ausstieg aus fossilen Brennstoffen von der Beheizung in Gebäuden und den Ausbau von Solarkraftwerken zu fördern. Die Mitgliedstaaten müssen dafür sorgen, dass neue Gebäude solarfähig sind, das heißt, sich für das Anbringen von Photovoltaik- oder Solarthermieanlagen auf dem Dach eignen. Das Installieren von Solarenergieanlagen soll für neue Gebäude zum Normalfall werden. Subventionen für das Installieren von eigenständigen Heizkesseln, die mit fossilen Brennstoffen betrieben werden, sind ab dem 1. Januar 2025 nicht mehr zulässig.
Außerdem wird die Richtlinie dank der Bestimmungen über Vorverkabelung, Ladepunkte für Elektrofahrzeuge und Fahrradstellplätze die Akzeptanz nachhaltiger Mobilität fördern.
Energiearmut bekämpfen
Eine bessere Planung von Renovierungen and technische und finanzielle Unterstützung werden von entscheidender Bedeutung sein, um eine Renovierungswelle in der gesamten EU auszulösen. Um Energiearmut zu bekämpfen und die Energiekosten zu senken, müssen die Finanzierungsmaßnahmen Anreize für Renovierungen schaffen und insbesondere auf schutzbedürftige Kunden und Gebäude mit der schlechtesten Energieeffizienz ausgerichtet sein, in denen ein höherer Anteil der von Energiearmut betroffenen Haushalte lebt.
Nächste Schritte
Die überarbeitete Richtlinie wird im Amtsblatt der Union veröffentlicht und tritt in den kommenden Wochen in Kraft. Die Mitgliedstaaten müssen sie dann in nationales Recht umsetzen.
Background
Auf Gebäude entfallen rund 40 Prozent des Energieverbrauchs der EU, mehr als die Hälfte des Gasverbrauchs in der EU (hauptsächlich durch Heizung, Kühlung und Warmwasser) und 35 Prozent der energiebedingten Treibhausgasemissionen. Derzeit sind etwa 35 Prozent der Gebäude in der EU älter als 50 Jahre, und fast 75 Prozent des Gebäudebestands sind ineffizient. Gleichzeitig liegt die durchschnittliche jährliche Quote energetischer Renovierungen bei nur etwa ein Prozent.
Further information
Vollständige Pressemitteilung
Quelle: EU-PM vom 12.4.2024
Keywords:
DE-News, Renewable, Building, Climate protection, News Blog Europe (without DE), PlusEnergy house/settlement, Environmental policy